You’re probably thinking: Cloud Foundry already has a magical way of figuring out how much CPU resources to give to your application. You can also see your CPU usage when running cf app <app-name>. So what is this all about?
Well, the thing is…
The current way Cloud Foundry handles CPU resources doesn’t really work.
Let’s look at the three main reasons why.
Problem 1: Unreliable CPU metrics
Let’s say you push an app and you see that it is currently using 30% CPU. Great! Then after some time, although your app is doing the exact same amount of work, the percentage changes to 200%. How is that possible?
The percentage you see depends on multiple factors not visible to the user. If the metric reports your CPU usage changed, it does not necessarily mean your application CPU consumption changed. It could be, for example, that another application landed on the same Diego cell, so what changed is the amount of CPU that you would expect to get.
That makes it difficult for users to predict how much CPU their application consumes and needs. The metric can’t answer questions like “How will my application perform in production?” or “Will my application perform OK in the future with the resources that it currently has?” Autoscaling is also out of the question.
Problem 2: Constantly high CPU applications can disadvantage other applications
If you have a Diego cell with 10 applications of the same size, the average “fair share” entitles each of them to around 10% of the CPU. That means that each of the applications can always get 10% of the host CPU and will be allowed to use more if there are some spare CPU resources on the host. But what happens if you land on a Diego cell with a lot of constantly-high CPU apps that always consume as much CPU as they can get? There will never be spare resources and you will never be able to spike over your fair share even if you were using far less than your entitlement most of the time. This could lead to poor user experience.
Problem 3: Having to overcommit resources
Operators want to build a perfect world where apps can use more than their fair share when they need to (for example, on application startup). In theory, that should be possible since usually most of the applications use less than their fair share, giving some spike opportunities to other applications. But if you have a lot of constantly high CPU apps as described in Problem 2, that won’t be possible. Thus, in order to ensure good applications their spikes, operators usually overcommit resources that stay idle most of the time.
Hopefully this gives you a good idea of why we really wanted to change how Cloud Foundry handles CPU resources.
The solution: CPU entitlement
Our first step was to introduce a thing called CPU entitlement for applications, which is the amount of CPU that your instance size entitles you to get. Currently it is being calculated based on the requested memory limit of your application, so a 128MB application is entitled to use twice as much CPU as a 64MB application.
The exact mapping from memory to CPU is determined by the platform operator through a bosh release property on the garden release called experimental_cpu_entitlement_per_share_in_percent. More information on how to configure the property depending if you want to under- or overcommit CPU resources can be found here.
The second step was to consume the CPU entitlement and expose a new Cloud Foundry metric which is relative to it. The new metric can be consumed through the cpu-entitlement-plugin. The reason we didn’t overwrite the old metric that you see when doing cf app is because there is a big difference in the behaviour of the two metrics and we want to make sure that people will have enough time to adapt to the new one.
The difference in the behaviour is the following: let’s imagine you have an application which is constantly consuming 30% of the system CPU. For the old metric, it doesn’t matter if the application is entitled to use 30% or 60% percent of the system CPU — it will always show 30%, although in the first case it is using its whole entitlement and probably needs to be scaled, and in the other, it consumes only half of what it gets. Our new metric on the other side will show you respectively 100% and 50%.
| CPU consumption
(% of host) |
entitled to use
(% of host) |
old metric | new metric |
| 30% | 30% | 30% | 100% |
| 30% | 60% | 30% | 50% |
The output of the cpu-entitlement-plugin currently looks like this:

You can see two values: avg and current usage. Both of them are relative to the CPU entitlement of the application. So if you see 100%, you are currently using all the CPU to which you are entitled by your instance size. 110% would mean there is some spare CPU on the machine and your application is allowed to spike this time, but you don’t have a guarantee that this will always happen. The difference between the two is that the average usage is accumulated through the life of the application and the current usage shows the current state. In the example above, the application is currently using more than it’s entitled to use in this moment, so the current usage is 181.31%. The average usage, however, is less than 100% because the application wasn’t consuming its entitlement all the time since creation and it has some buffer to fill before it reaches 100%.
Since the average usage is the one we care about more, we will also print warnings if you are over your entitlement. Since you don’t have a guarantee that you application will always be able to get this CPU, if you depend on it, you should consider scaling your instance size.

We will also warn you if your application is close to its entitlement so you can scale before your application gets throttled.

If you don’t want to check the metric all the time but still want to know if your application depends on more resources than it is actually getting — we also thought about you. The plugin will tell you if your average ever went over 100% and some additional information like when and for how long.

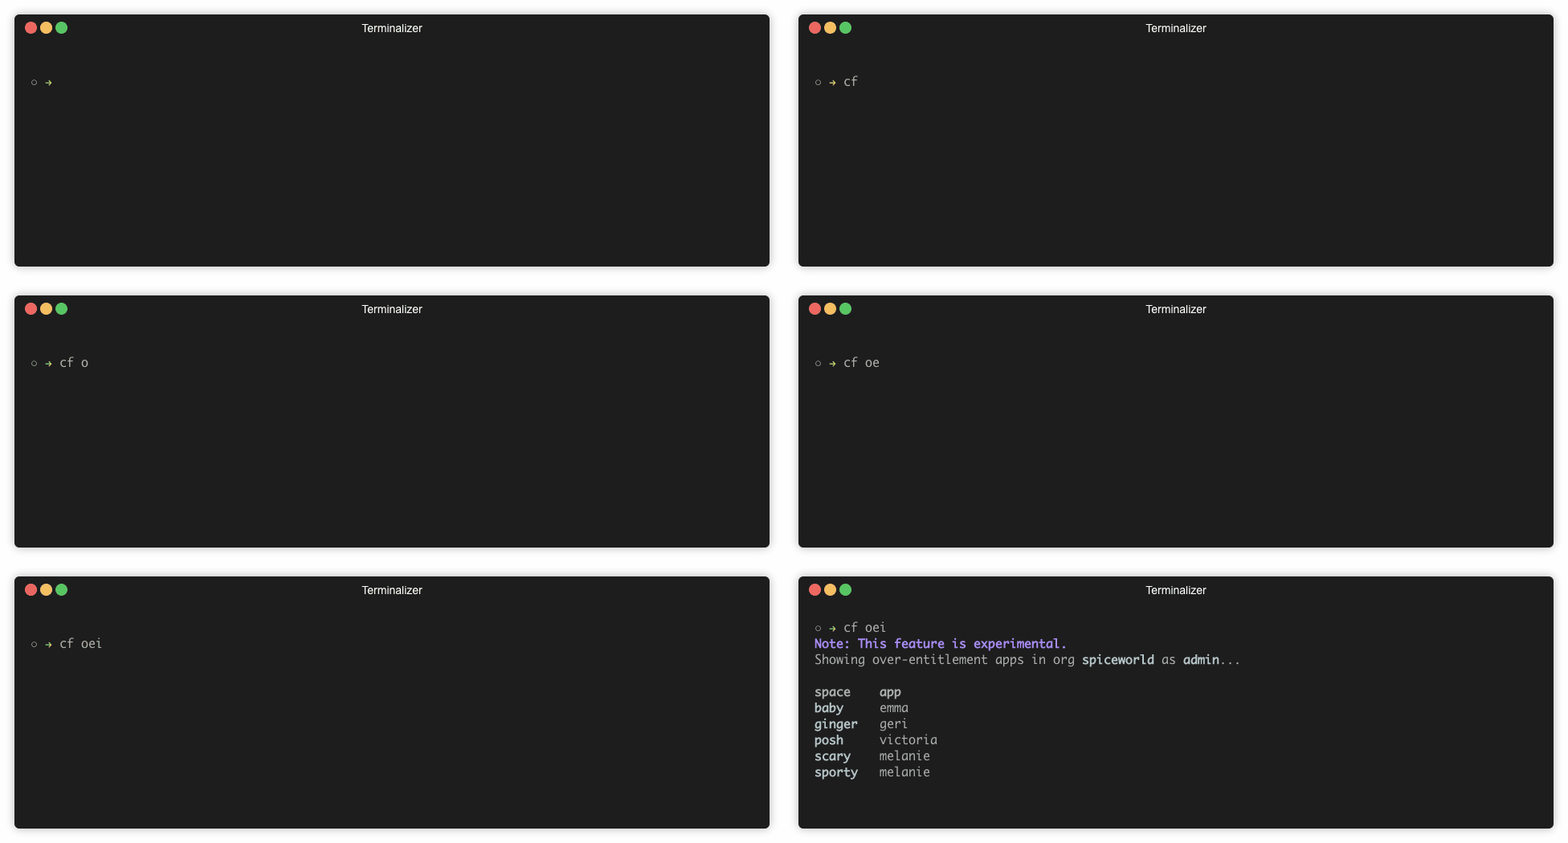
The plugin has one more useful command, which you can use to list applications in a concrete organization that are over their entitlement.

So we provided users and operators the tools to observe how the system is behaving.
What’s next?
Our plan is to use all of this data to change the way that CPU resources are being distributed and start throttling some applications.
We are going to split applications into two groups:
- good apps – apps that have stayed below their entitlement over the last period (avg column)
- bad apps – apps that have used more CPU than they were entitled to over the last period
All apps start as good ones because we truly believe there is some good in this world. If the CPU average gets over 100%, it will get moved to the bad group until the average goes back under 100%.
The common thing between the two groups is that no matter which group your app belongs to, it is always guaranteed to get its entitlement.
The main difference can be seen when there are some spare CPU resources on the machine. If there are good applications that need to spike over their entitlement, they will be allowed to do that. If that is not the case, then the spare resources will be given to the bad applications. A key point here is that bad applications will be allowed to go over 100% but ONLY if there are no good ones that want to do the same.
Another important thing to notice is that bad applications will only get throttled when there are not sufficient resources for everyone. As a result, good applications should not see any negative difference in performance. Even better, limiting bad applications should ensure the good ones even better performance without the need for operators to overprovision resources to account for bad applications using more than their entitlement. The so-called bad applications will be able to see clearly that they depend on more resources than they pay for and act on it — either by changing the behaviour in the applications (maybe there were some leaks?) or just asking for a bigger instance size.
Do you have any thoughts on the topic? We will be happy to hear them in our Garden slack channel!
Credits to the Garden Engineers working on the feature at time of writing: Georgi Sabev(SAP), Giuseppe Capizzi (VMware), Danail Branekov (SAP), Kieron Browne (VMware), Yulia Nedyalkova (SAP)
Product Manager: Julz Friedman (IBM)


