The Cloud Foundry Routing subsystem handles and forwards all incoming requests to platform system components and applications. As such, the latency and throughput of the routing components has significant impact on the performance of your applications. Seemingly harmless code changes to these components could lead to unexpected performance regressions. A recent performance degradation in the
GoRouter prompted the Routing team to investigate approaches to detect regressions as they are introduced.
While the main goal is to find and fix regressions, performance testing also enables the team to establish a baseline benchmark for the routing tier, and better educate Cloud Foundry operators on how to scale their deployment.
Creating this benchmark involves answering a number of questions. What metrics are important to watch? How should these metrics be measured? How can regressions be guarded against?
Here’s what we’ll cover:
Routing Performance Benchmarking Setup
A critical part of performance testing is to ensure as few variables as possible change during each run of the experiment. This generates more consistent results, and allows easier comparison between test runs.
In a typical science experiment setup, the variables are separated into dependent, independent, and controlled variables.
- Dependent variables: The dependent variables for this testing are of course the throughput and latency numbers that result from our performance benchmarking, as well as the CPU usage of the router VMs during the test runs.
- Independent variables: For independent variables, while there are a great many knobs to twist and turn in order to see how the system performs, currently only the version of the software running is changed. Since the first goal is to prevent regressions, running the exact same tests against different versions of the software enables the team to quickly see any performance degradation that might have been introduced.
- Controlled variables: Besides these variables, everything else is controlled and kept static, or the impact is minimized in the case of virtual machines.
Load Generating
The load generating tool used for performance setup is a simple utility called
hey. Hey is very similar to ApacheBench (ab) in its ease of use. It does not require as complicated of a setup as other load generating frameworks. It is also easy to parse the output for automated testing so tests could easily be run in a continuous integration pipeline. These tests were performed on
Amazon Web Services, and the routers are deployed with the default instance types as can be seen in the table below.
Cloud Foundry Routers
There are two types of routers in Cloud Foundry:
- GoRouter: An L7 router responsible for routing HTTP and websocket requests;
- TCP Router: An optional L4 router that handles routing of non-HTTP TCP requests. Read more about TCP routing.
A single VM serving a static response with a size of 1kb acts as the backend for both routers. Custom jobs responsible for registering thousands of routes through NATS or the Routing API are also deployed to more accurately replicate a production environment.
A list of the different VMs, their responsibilities, and AWS instance types can be found below.
| Instance Type |
Description |
VM Instance Type |
| GoRouter |
VM running gorouter and metron agent. |
c3.large |
| NATS |
GoRouter receives HTTP routing table configuration from NATS. |
m3.medium |
| TCP Router |
VM running TCP Router (HAProxy), TCP Routing Table Configurer, and metron agent. |
c3.large |
| Routing API |
TCP Router receives TCP routing table configuration from the Routing API |
m3.medium |
| Static App |
VM running the static app backend under test |
m3.medium |
| Bulk Registrar |
VM running client utilities that register HTTP routes to NATS and TCP routes to routing-api. |
m3.medium |
| Performance Testing Client VM for GoRouter |
VM generating HTTP connections through the router and gathering performance metrics. |
c3.large |
| Performance Testing Client VM for TCP Router |
VM generating HTTP/TCP connections through the router and gathering performance metrics. |
c3.2xlarge |
Router deployment
Routers were deployed standalone as opposed to Cloud Foundry + Diego for a few reasons:
- It is expensive to maintain another full Cloud Foundry installation since there would have been many idle instances accruing cost.
- There appeared to be a decrease in throughput performance to containers in Diego cells as opposed to traffic to standard VMs. Whatever the reason may be, adding extra variables to the experiment (i.e. bottlenecks in the Diego layer) would only complicate the results.
- It is extremely quick to deploy and retains full control of all the variables that go into the performance benchmarking.
Below is the current setup for both a GoRouter and TCP Router:
GoRouter Setup

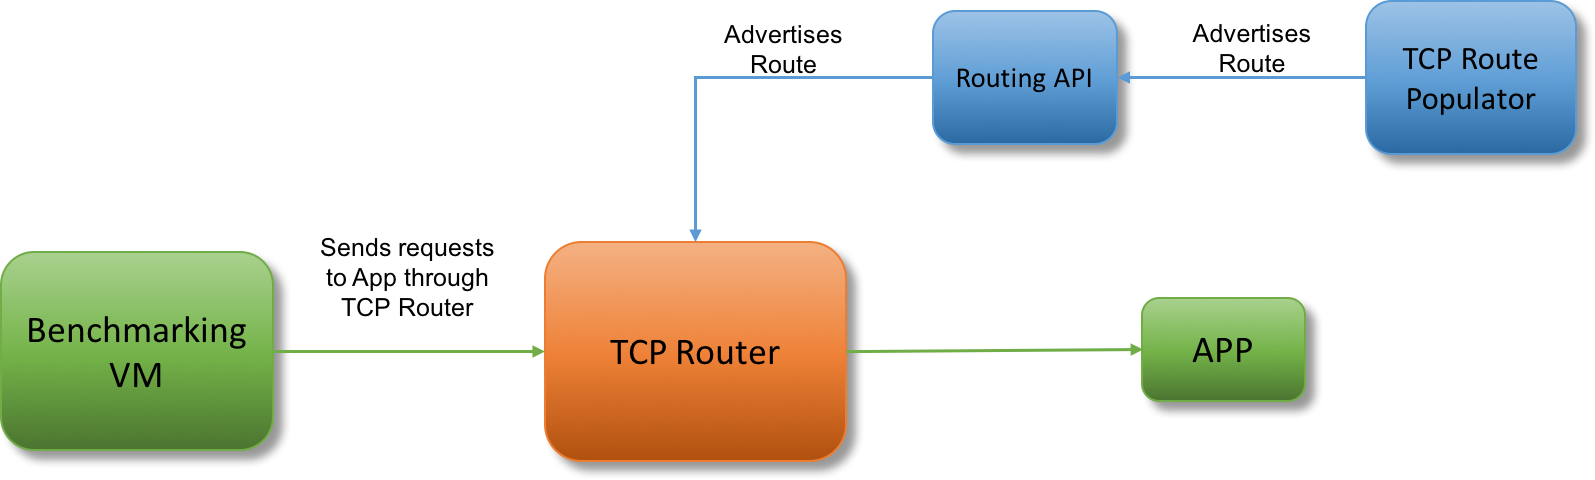
TCP Router Setup
Load Profiles
The initial round of testing focused on measuring CPU, throughput and latency. The initial load profile was chosen based on how the routers could perform at max load. However, focusing on both latency and max throughput was difficult as they are negatively correlated. The focus shifted toward measuring the routers at what was considered a “normal” profile which was defined as not at maximum CPU usage. Using the tool hey, the number of concurrent requests that should be sent was chosen so that the router VM would hover at about 70% CPU usage.
Our goal was to replicate a normal load, but defining “normal” was difficult, especially since there is no particular production environment. Currently production deployments of Cloud Foundry differ vastly and defining “normal” is not necessarily possible. The way the load profiles are set does not allow for varying the type of requests and responses or making long lived connections. Both of those are reasonably expected in most production systems, making the performance testing more of a single benchmark than indicative of the router’s overall performance. Another major concern was that with a singular load profile, the benchmark does not test what happens as the routers scale and the load increases. Without that information, the tests may miss performance regressions that occur at different load profiles. Overall the singular load profile at around 70% CPU usage was a good starting point.
An issue encountered during the implementation of the tests was whether or not to use the same load profile for the GoRouter and TCP Router. Initially, it seemed that using the same load would make the data more comparable during analysis. However the TCP Router was significantly underwhelmed and making comparisons between the GoRouter and TCP Router was not a goal of these performance tests.
The TCP Router was significantly more performant than the GoRouter, and a number of outside variables caused artificial bottlenecks in testing. The TCP Router was able to saturate the network bandwidth, so the request sizes had to be reduced. There was also a bug that limited the number of sockets it could open, so it was necessary to increase the file descriptor limit. As the load was increased enough to cause some stress for the tcp-router it became apparent that the benchmarking VM was not powerful enough to hit maximum load on the TCP router. The benchmarking VM was then made more powerful (from a c3.large to a c3.2xlarge) to make sure the client VM was not a bottleneck.
Benchmarking Results
The results below are not meant to be compared with each other; they are benchmarks of independent components with different purposes and capabilities. GoRouter is a L7 HTTP router and has a great deal of logic for handling HTTP requests. The TCP Router operates on L4 and is agnostic to TCP protocols; it is just copying packets across connections. Therefore we expect the TCP Router to be far more performant.
On the environment described above, we saw the following results:
| Router |
HTTP |
TCP |
| Request size |
~0KB |
~0KB |
| Response size |
1KB |
1KB |
| Router VM Type |
c3.large |
c3.large |
| Router Kernel Tuning |
Number of TCP level tunings applied* |
None |
| Backend VM type |
c3.medium |
c3.medium |
| Load Source VM Type |
c3.large |
c3.2xlarge |
| Routing table (# routes) |
100,000 |
1000 |
| # requests |
150,000 |
1,500,000 |
| Concurrent connections |
2 |
64 |
| Requests per second |
~1.2K |
~44K |
| Latency Distribution (ms) |
Distribution:
90th: 1.6ms
95th: 1.7ms
99th: 2.3ms |
Distribution:
90th: 1.4ms
95th: 1.5ms
99th: 2.2ms |
Guidance for Operators on Horizontally Scaling GoRouter
Based upon our findings above, we can recommend that operators monitor CPU load on GoRouter instances and add another instance when CPU reaches 70%. Beyond this threshold, throughput does not increase but latency does. Keeping CPU load below 70% maximizes throughput while ensuring that latency remains at a minimum.
What’s Next?
Currently, the performance testing has been integrated into the Routing Team’s CI to stop commits that introduce regressions. With a baseline, investigations to identify bottlenecks for possible improvements have begun. After fixing the largest bottlenecks found within the router, the next focus will be to implement a more complex performance test. These tests would involve incrementally increasing the throughput/concurrency and watch how the routers perform. The purpose of these tests would be to identify thresholds at which the router’s performance starts to degrade. Among the community, interest in how performant the router is at terminating TLS has been prominent, and will be another area of investigation for the Routing team.
Links for More Information
For more information on the Routing subsystem for Cloud Foundry, see the following links: